
How to Build a Power Budget for a Portable TFT Display
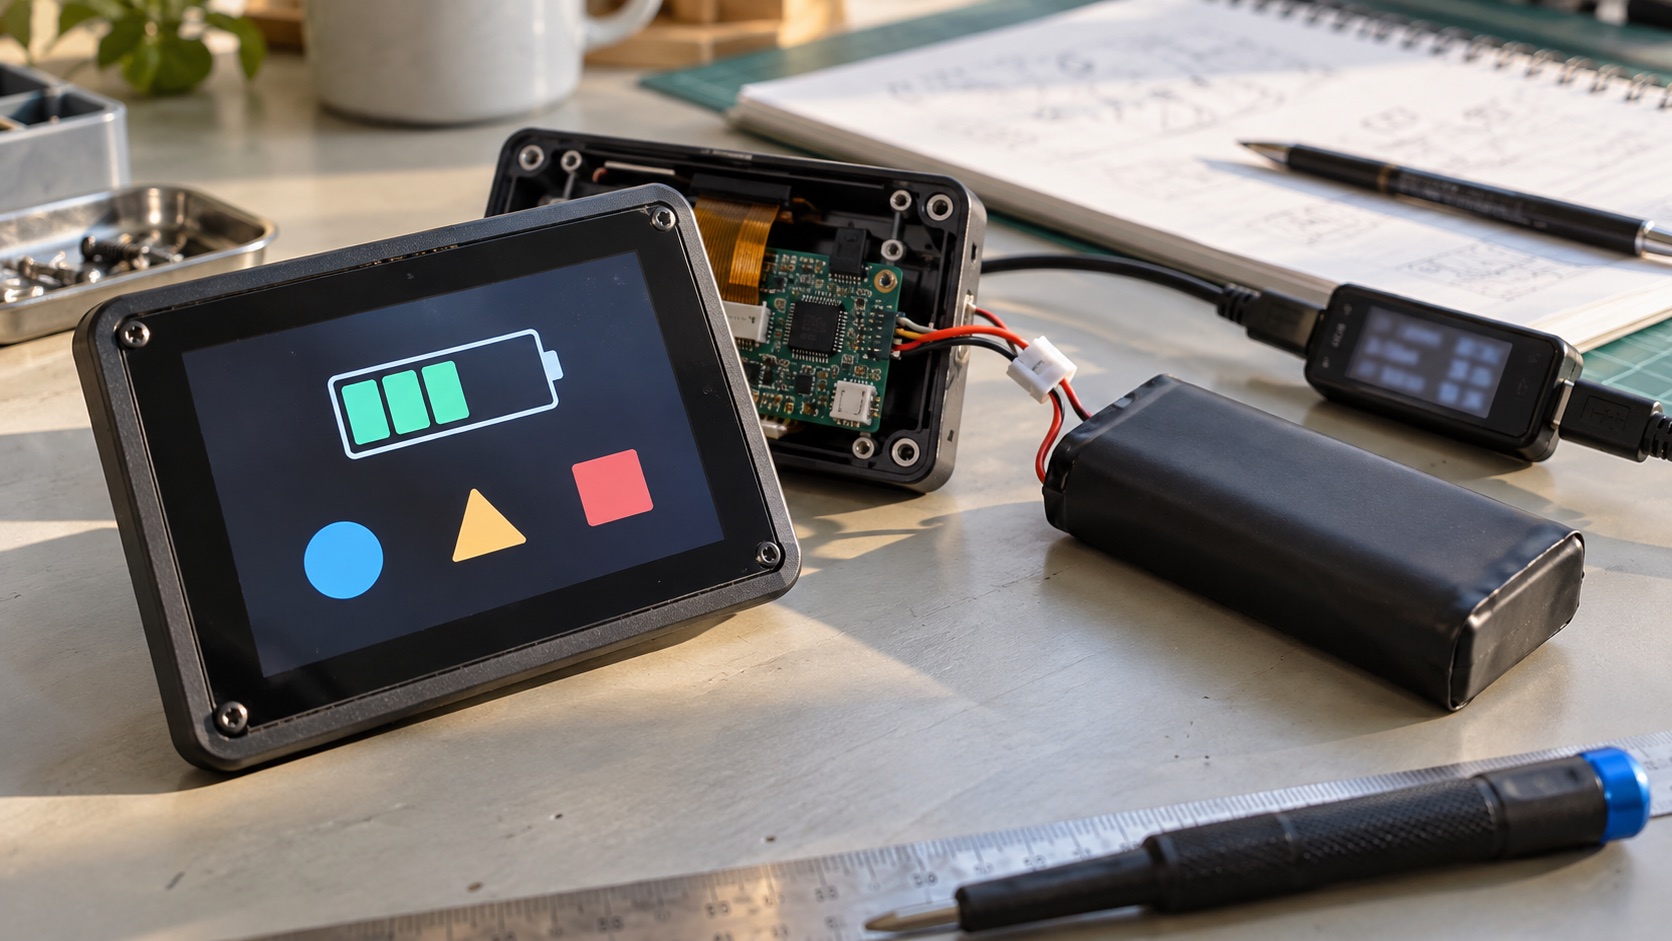
A portable TFT display power budget adds every required load at the battery boundary, weights each operating mode by time, and divides usable battery energy by average power. Backlight current alone is not the complete display load, and battery capacity in mAh cannot be compared directly with currents drawn from different supply voltages.
The worked budget below uses invented but plausible values to demonstrate the method. It is not a runtime claim for a particular product or a report of laboratory measurements. The hero image is an AI-generated illustration.
Set the Boundary of the Budget
Decide whether the goal is the display assembly’s power, its incremental effect on a host, or the complete product’s battery runtime. Label that boundary before collecting numbers.
For a complete portable product, include:
- LCD logic and any external bias supplies.
- LED backlight and its constant-current driver.
- Touch controller and associated interface circuitry.
- Processor, graphics engine, framebuffer memory, and display bridges.
- Regulators, load switches, level translators, and always-on circuits.
- Other product loads needed during the claimed use case.
Do not count an internal LCD bias rail again if the module’s measured input power already includes it. Likewise, battery-side measurements already include downstream conversion losses.
Convert Every Rail to Power
For a steady load:
Load_power_W = Load_voltage_V × Load_current_A
Input_power_W = Load_power_W / Converter_efficiency
Add input powers at a common supply boundary. If a conversion path has multiple stages, account for each stage or measure at the boundary directly.
Efficiency varies with input voltage and load. A converter’s headline peak efficiency is not a valid assumption for every operating mode. The TI TPS61099 datasheet, for example, distinguishes light-load behavior, shutdown, and efficiency under different conditions. It illustrates the need for operating-point data rather than a single percentage.
Avoid adding quiescent loss twice if it is already included in measured efficiency or input current. Define clearly whether an “overhead” row covers an additional circuit or a loss already accounted for elsewhere.
Worked Active-Mode Budget
Assume this illustrative product uses the following operating points:
| Load | Output-side assumption | Output power | Assumed efficiency | Battery-side power |
|---|---|---|---|---|
| LED backlight | 12 V string at 100 mA | 1.200 W | 85% | 1.412 W |
| LCD logic and included bias | 3.3 V at 60 mA | 0.198 W | 90% | 0.220 W |
| Touch controller | 3.3 V at 10 mA | 0.033 W | 90% | 0.037 W |
| Host and memory | Aggregate measured load | 0.600 W | 90% | 0.667 W |
| Other battery-side circuits | Not included above | — | — | 0.020 W |
| Total active mode | About 2.356 W |
The backlight figure is electrical LED power, not screen luminance. A different optical stack, screen area, LED arrangement, or efficiency can produce a different brightness at the same electrical power.
Do not confuse string current with total current across parallel strings. If three strings each carry 20 mA, the summed current is 60 mA before considering the conversion back to battery input.
The backlight driver guide and LCD power-rail guide help separate these loads.
Use Watt-Hours for the First Battery Estimate
A nominal 3.7 V, 3000 mAh battery has a nominal energy estimate of:
3.7 V × 3.0 Ah = 11.1 Wh
Suppose the design provisionally allocates 80% of that nominal energy as usable after accounting for its chosen cutoff, conditions, and reserve:
Usable energy = 11.1 Wh × 0.80 = 8.88 Wh
The 80% factor is an assumption for this example, not a general battery rule. Replace it with cell or pack discharge data and measurements at the relevant load, temperature, and age. Do not subtract converter losses again if the load is already expressed as battery-side power.
For continuous operation at 2.356 W, the estimate is 8.88 / 2.356 ≈ 3.77 hours. That result changes significantly when the screen is not continuously active.
Weight Active, Dim, and Sleep Modes by Time
Use an observed or clearly specified workload. An illustrative usage profile is:
| Mode | Assumed battery-side power | Fraction of time | Average-power contribution |
|---|---|---|---|
| Active screen and host | 2.356 W | 20% | 0.4712 W |
| Dim screen, reduced host activity | 0.700 W | 30% | 0.2100 W |
| Screen off, system standby | 0.020 W | 50% | 0.0100 W |
| Total | 100% | 0.6912 W |
Estimated runtime = Usable_energy_Wh / Average_power_W
                  = 8.88 / 0.6912
                  ≈ 12.85 hours
This estimate is valid only for the stated profile and assumptions. Startup, radio activity, and other events need separate energy terms if they are not already represented in the mode measurements.
For a repeated event, multiply energy per event by events per hour and include the resulting Wh/hour, equivalent to average watts. Do not hide a frequent wake-up burst inside an unrealistically low standby current.
Check Peak Power Separately From Runtime
Average power estimates energy use. Peak current determines whether the battery, regulator, wiring, and connector can maintain voltage during demanding events.
If an illustrative battery-side peak is 4 W at a loaded battery voltage of 3.0 V, input current is about 1.33 A. This is not the same as the roughly 0.79 A associated with the example’s 2.356 W active average at that voltage.
Test simultaneous backlight startup, processor load, and communication bursts. Include source impedance and connector drop. A low-battery brownout can end usable operation before nominal capacity is exhausted.
Use the power-sequencing guide to coordinate startup and recovery instead of treating a reset as an ordinary steady-state load.
Measure Energy Across a Representative Use Cycle
Measure voltage and current at the selected boundary with sufficient range and sampling behavior for both standby and active operation. A series shunt can introduce voltage drop; verify that the measurement fixture does not change the operating mode or trigger a brownout.
The TI INA228 power-monitor documentation describes voltage, current, power, energy, and charge measurements as distinct outputs. That distinction is useful for variable loads: accumulated energy and charge answer different questions when voltage changes.
Log the firmware build, brightness setting, measured luminance, panel refresh rate, touch scan behavior, workload, and battery conditions. Capture an entire representative cycle, including sleep entry and wake-up.
Choose conversion time and averaging carefully. A smooth average trace may be appropriate for energy accounting but can hide a brief current peak. Use an additional transient capture when power integrity is part of the validation.
Prioritize Changes by Their Energy Contribution
In this example, the active-mode backlight is the largest single contribution. Reducing LED output power from 1.2 W to 0.6 W at the same assumed efficiency saves about 0.706 W while active. At 20% active time, that saves about 0.141 W in the average budget.
Whether that reduction is acceptable depends on readability. Compare changes at a defined ambient light and viewing condition, using brightness calibration to avoid comparing inconsistent luminance settings.
Other useful levers include idle dimming, shorter unnecessary screen-on time, supported partial updates, host sleep, and lower standby leakage. MIPI command-mode updates can reduce transfer activity in suitable systems, but their value must be measured against the whole budget.
A black image does not turn off a conventional global TFT backlight. Similarly, halving refresh rate does not automatically halve total power. The PWM frequency guide explains another distinction: dimming control and image refresh are different mechanisms.
Keep a Budget That Can Be Updated
For each row, retain the source of the value: datasheet limit, estimate, or measurement. Record the conditions and confidence level. Replace early assumptions as prototype measurements become available, then repeat with production hardware and the intended battery pack.
The finished record should contain mode powers, time fractions, peak current, usable energy assumptions, and measured runtime under the same workload. That gives product teams a repeatable basis for battery claims and engineering trade-offs.
Frequently Asked Questions
How do I calculate a TFT display's power consumption?
Add the LCD logic and bias, backlight, touch controller, host and memory, and other required loads at a common measurement boundary. Include conversion losses where they have not already been measured. Calculate separate active, dim, sleep, and startup conditions.
Can I calculate battery life by dividing battery mAh by display current?
Only when the current is measured at the battery side and the assumptions about voltage, load profile, and usable capacity are valid. For loads on different supply rails, convert to power and usable battery energy first.
Does a black screen save power on a TFT LCD?
A conventional globally backlit TFT still uses backlight power to show black. Savings require a change in backlight drive, supported local dimming, panel operation, or host activity; changing image pixels alone is not an OLED-like power-saving rule.
Does lowering refresh rate halve display power?
Not generally. It may reduce some transfer and processing activity when supported, but the backlight and other fixed loads remain. Measure the entire system at equivalent brightness and workload.
Why is measured battery runtime lower than the first estimate?
Common causes include converter losses, unrealistic active-time assumptions, peak-load voltage sag, cutoff limits, temperature, battery aging, and always-on circuits omitted from the budget. Validate usable energy and the real workload.